

Home / Track record
Track record
What the index has said each morning since it began, and what its hard data alone would have said in the five years before. The second is a replay, not a record: read the limits before the numbers.
Replay run · covers to
The live index
We have published a reading on 27 mornings, from Oct 25, 2026 to Nov 20, 2026. The lowest was 47 on Oct 31, 2026 and the highest was 56 on Nov 19, 2026. Every one has a permanent page in the daily archive, and past readings are never rewritten when the method changes. The changes are dated on How it works, and numbers that turned out wrong are in the corrections log.
That is a short record. It hasn’t yet covered a full credit cycle, so it can’t show how the index behaves through one.
The replay
For each trading day from Nov 10, 2021 to Nov 9, 2026, we scored every data series using only what was known on that day, then averaged the scores into signals, layers and an index the same way the live index does. Nothing is scored on numbers that came out later.
It is not the live index. The live index blends each signal’s data with a news grade set every morning, and old news can’t be graded again fairly. So the replay uses data alone: 6 of the 17 signals have a data series that can be replayed, and the other 11 are left out. Two whole layers have none and are missing throughout: Collateral loses value and People behave strangely.
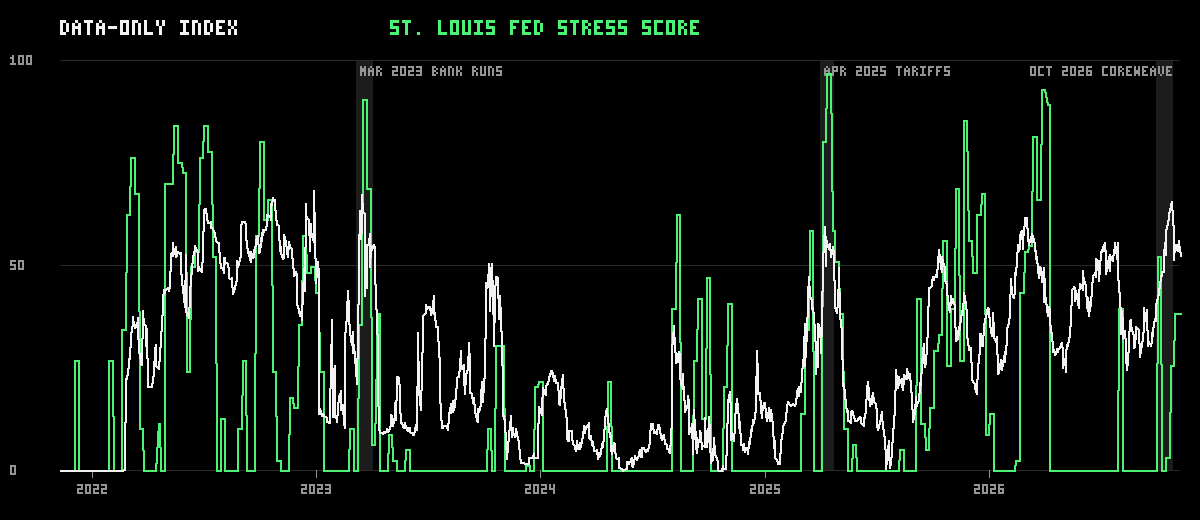
White: the replay. Green: the St. Louis Fed Financial Stress Index, scored the same way, for comparison. Shaded: the stress windows below.
Three stress windows
We picked these after the fact, as the sharpest credit scares in the period. The index is 0 to 100; 60 and up is the Warning band.
| Window | Average, 90 days before | Average during | Peak | Peak day | Layers with data |
|---|---|---|---|---|---|
| March 2023: the runs on Silicon Valley Bank and other regional banks | 31.2 | 52.5 | 67.2 | Mar 16, 2023 | 3 of 6 |
| April 2025: the tariff selloff | 20.5 | 51.2 | 59.4 | Apr 8, 2025 | 4 of 6 |
| October 2026: the CoreWeave drop | 39.4 | 53.5 | 65.6 | Oct 26, 2026 | 4 of 6 |
The replay averaged higher during each window than in the 90 days before it. It also read 60 or more on 35 trading days outside these windows, out of 45 such days in all, so a high reading has not always meant trouble followed.
How much history each series has
A series ranked against its own history needs a year of data before its first score, so “scored from” is a year after “data from”. A series on a fixed scale is scored from the first day its reading could have been known. The replay starts thin and fills in as series reach their first score.
| Series | Signal | How it’s scored | Updates | Data from | Scored from | Scored readings |
|---|---|---|---|---|---|---|
| Neocloud stocks vs their 125-day average | Neocloud stocks | Ranked against its own last three years | Daily | May 10, 2022 | May 10, 2023 | 879 |
| Watched stocks within 10% of a 52-week low | Neocloud stocks | Ranked against its own last three years | Daily | Nov 9, 2022 | Nov 9, 2023 | 752 |
| CRWV swings vs its 90-day norm | Neocloud stocks | Ranked against its own last three years | Daily | Sep 4, 2025 | Sep 4, 2026 | 46 |
| Neoclouds vs big AI spenders, last 20 days | Neocloud stocks | Ranked against its own last three years | Daily | Dec 9, 2021 | Dec 9, 2022 | 982 |
| Selling volume vs normal, BDCs and neoclouds | Neocloud stocks and Public BDC discounts | Ranked against its own last three years | Daily | Jan 24, 2022 | Jan 24, 2023 | 953 |
| Listed BDCs down over 20 days | Public BDC discounts | Ranked against its own last three years | Daily | Dec 9, 2021 | Dec 9, 2022 | 982 |
| Listed BDCs vs their 52-week high | Marks vs market prices | Ranked against its own last three years | Daily | Nov 9, 2022 | Nov 9, 2023 | 752 |
| Junk bonds vs Treasurys of similar maturity, last 20 days | Pulled deals | Ranked against its own last three years | Daily | Dec 9, 2021 | Dec 9, 2022 | 982 |
| Credit stress (credit part of the OFR stress index) | Pulled deals | Ranked against its own last three years | Daily | Jan 2, 2015 | Jan 4, 2016 | 2,771 |
| Banks tightening business loans (net) | Bank lines to funds | Ranked against its own last three years | Quarterly | Jan 1, 2015 | Jan 1, 2016 | 44 |
| Bank loans to nonbanks, 13-week change | Bank lines to funds | Ranked against its own last three years | Weekly | Apr 8, 2015 | Apr 13, 2016 | 551 |
| Fund sales less redemption requests, % of net assets (non-traded BDCs) | Redemption gates | Fixed scale | Quarterly | Q4 2023 | Feb 7, 2024 | 12 |
| Big banks whose private credit lines shrank in the quarter | Bank lines to funds | Fixed scale | Quarterly | Mar 31, 2025 | Jun 14, 2025 | 6 |
Fund flows have 12 quarterly readings, Q4 2023 to Q3 2026. The first could be read on Feb 7, 2024, when the last tender result behind it was filed.
Bank lines have 6 quarterly readings, the quarters ended Mar 31, 2025 to Jun 30, 2026. Banks only began reporting loans by kind of borrower with the December 2024 report, so there is nothing earlier to replay. Each reading joins the replay 75 days after its quarter ends, about when the reports come out.
Neither series has been through a credit crisis. They are in the replay so it matches today’s method, not because their past proves anything.
When each layer joins the replay
The replay averages only the layers that had a scored series that day. Early on that is one or two layers, so the early numbers are the roughest.
| Layer | First day with data |
|---|---|
| Collateral loses value | Never: no data series to replay |
| Weakest borrowers crack | Dec 9, 2022 |
| Loans quietly go soft | Nov 9, 2023 |
| Funds feel pressure | Dec 9, 2022 |
| Plumbing tightens | Nov 10, 2021 |
| People behave strangely | Never: no data series to replay |
Month by month, last 24 months
| Month | Average | High | Layers with data |
|---|---|---|---|
| Nov 2026 | 54.5 | 56.1 | 4 |
| Oct 2026 | 54.1 | 65.6 | 4 |
| Sep 2026 | 34 | 40 | 4 |
| Aug 2026 | 33.1 | 39.1 | 4 |
| Jul 2026 | 51.9 | 55.7 | 4 |
| Jun 2026 | 45.4 | 51.6 | 4 |
| May 2026 | 37.1 | 45.6 | 4 |
| Apr 2026 | 33.4 | 46.9 | 4 |
| Mar 2026 | 53.2 | 61.7 | 4 |
| Feb 2026 | 49.4 | 61.8 | 4 |
| Jan 2026 | 29.9 | 38.6 | 4 |
| Dec 2025 | 29.1 | 39.8 | 4 |
| Nov 2025 | 37.2 | 43.5 | 4 |
| Oct 2025 | 46.7 | 53.8 | 4 |
| Sep 2025 | 28.6 | 46.1 | 4 |
| Aug 2025 | 21.4 | 25 | 4 |
| Jul 2025 | 8.3 | 14.6 | 4 |
| Jun 2025 | 15.3 | 21.7 | 4 |
| May 2025 | 19.3 | 49.6 | 4 |
| Apr 2025 | 48 | 59.4 | 4 |
| Mar 2025 | 34.7 | 47.3 | 4 |
| Feb 2025 | 16.9 | 20.6 | 4 |
| Jan 2025 | 8.6 | 15.4 | 4 |
| Dec 2024 | 13.4 | 29.2 | 4 |
What this doesn’t show
- The replay uses today’s method on yesterday’s data. We chose the series and the scales in 2026, knowing how these episodes went. A record kept in real time would likely look worse.
- Three windows in five years is too few to measure how often the index is right.
- The replay number and the live number aren’t on the same footing: the live index adds the news grade and the signals with no data series.
- Some stocks behind the series listed only recently (CoreWeave in 2025), so their series start late.
- It says how stressed the data looked on a day. It doesn’t say what happens next. This isn’t a timing tool or financial advice.
How the live index is scored: How it works. What each feed looked like this morning: Data status.